Visualizing System Complexity: Mastering Diagram Views

Estimated reading: 3 minutes

Beyond Static Images

In many modeling environments, the diagram is merely a “read-only” snapshot of the code—a static image that you can’t touch. When your system model grows to include hundreds of components, you need more than just a picture; you need an interactive environment that allows you to explore and refine your architecture visually. A SysML v2 tool should empower you to work in whatever way is most natural for the task at hand.

SysML v2 Studio provides a high-performance SysML v2 visualization engine that is both interactive and editable. Whether you are navigating a complex hierarchy through our scope-based rendering or tweaking a connection directly on the canvas, our diagrams are a live extension of your system model, fully compliant with the SysML v2 standard.

The Dynamic Diagram Environment

Our SysML v2 editor provides a unique set of visual capabilities designed for the modern systems engineer:

1. Scope-Based Rendering (Dynamic Focus)

To prevent “diagram clutter,” the viewer automatically adjusts its focus based on your cursor’s position in the code. When you click inside a specific definition, the diagram re-renders to show only that scope. This ensures that even in a file with thousands of lines, you always have a clear, focused view of the component you are currently designing.

2. Editable Diagrams

Visual modeling is not just for viewing; it’s for creating. Our diagrams are interactive, allowing you to move elements, refine layouts, and in many cases, modify relationships directly on the canvas. This “Bi-Directional” approach means you can start a design in code and polish it visually, or vice versa.

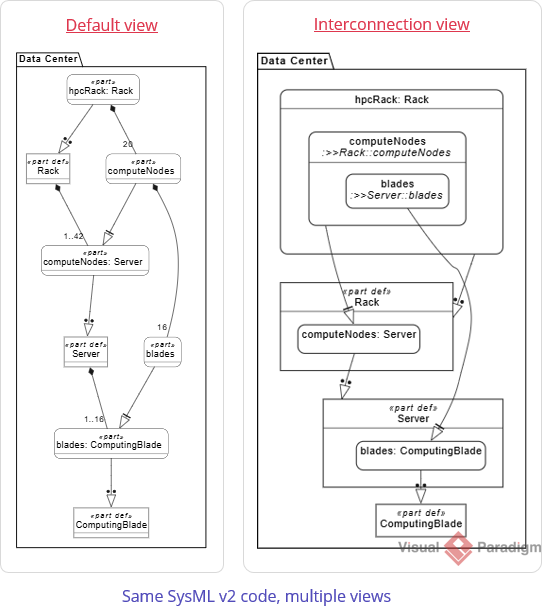
3. The “Multiple Views” Paradigm

Switch between specialized lenses to see your system from different architectural perspectives:

  • Default/Tree: Focused on structural decomposition and containment.
  • Interconnection: Visualizes ports and interfaces as a functional wiring diagram.
  • Case: Dedicated to Requirements and Use Case traceability.
  • Behavioral (State/Action/Sequence): Shows how the system logic flows over time.

Step-by-Step Tutorial: Interactive Exploration

In this tutorial, you will explore the Automobile case study and interact with the diagram canvas.

  1. Open a Case Study: In the Examples pane, open Training > 009. Parts > 04. Data Center Server Rack.sysml.

  2. Experience Dynamic Focus: Click on different part definitions in the code editor (e.g., Server, then hpcRack : Rack). Watch the Diagram Viewer update instantly to show the internal structure of each part.

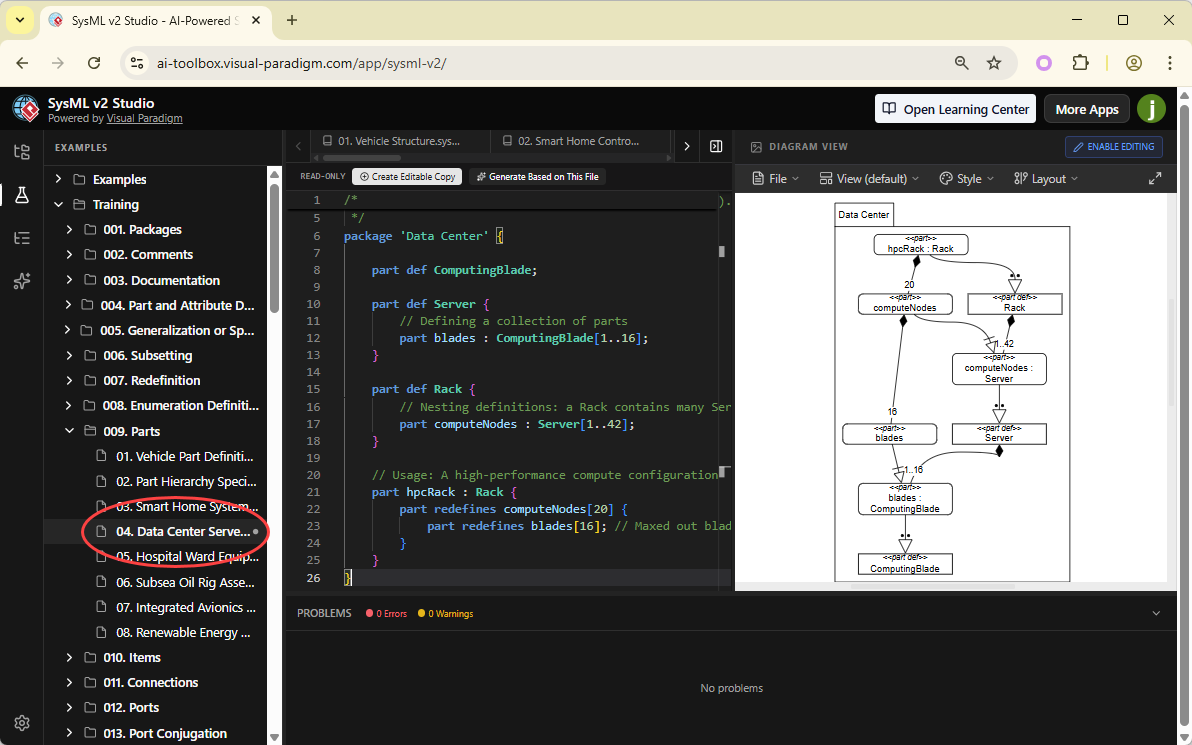
  3. Switch to “Interconnection” View: Use the view dropdown at the top of the diagram pane. This view shows how the subsystems are wired together.

  4. Interact with the Canvas: Let’s edit this diagram. Click on Create Editable Copy on top of the editor.

    Click on Enable Editing on top of the diagram viewer.

    Then, try clicking and dragging elements on the diagram. You can re-arrange the layout to better understand the flow. (Note: Depending on the specific view mode, you may be able to add or modify connections directly). Note that the changes made in the diagram will not sync with the code. Yet you can touch up the layout and export the latest diagram as image (PNG / SVG).

What You’ve Learned

By mastering diagram views, you’ve turned your SysML v2 code into a living, interactive model. You now know:

  • How **Scope-Based Rendering** provides a focused lens on your code.
  • The power of **Editable Diagrams** in a bi-directional modeling workflow.
  • The importance of **Full Standard Compliance** in both text and graphics.

Visualization is the first step to truly understanding your architecture. In the next chapter, we’ll look at how to customize these diagrams even further using advanced layout and styling controls.

Share this Doc

Visualizing System Complexity: Mastering Diagram Views

Or copy link

CONTENTS
Scroll to Top